Providing exceptional support is no longer an option but a necessity. As a result, teams must track and analyze the right customer service metrics to ensure their teams are meeting these expectations.
It’s tough not to become so entwined with the numbers that you cannot see the forest for the trees.
We’ve compiled a list of the top customer service metrics and key performance indicators (KPIs) every customer service leader should know. Familiarize yourself with the acronyms and calculations to decipher which are most relevant to you and your goals.
In other words, know your CSAT from your CATS.
Infographic: 16 Customer Service Metrics (What, Why and How)
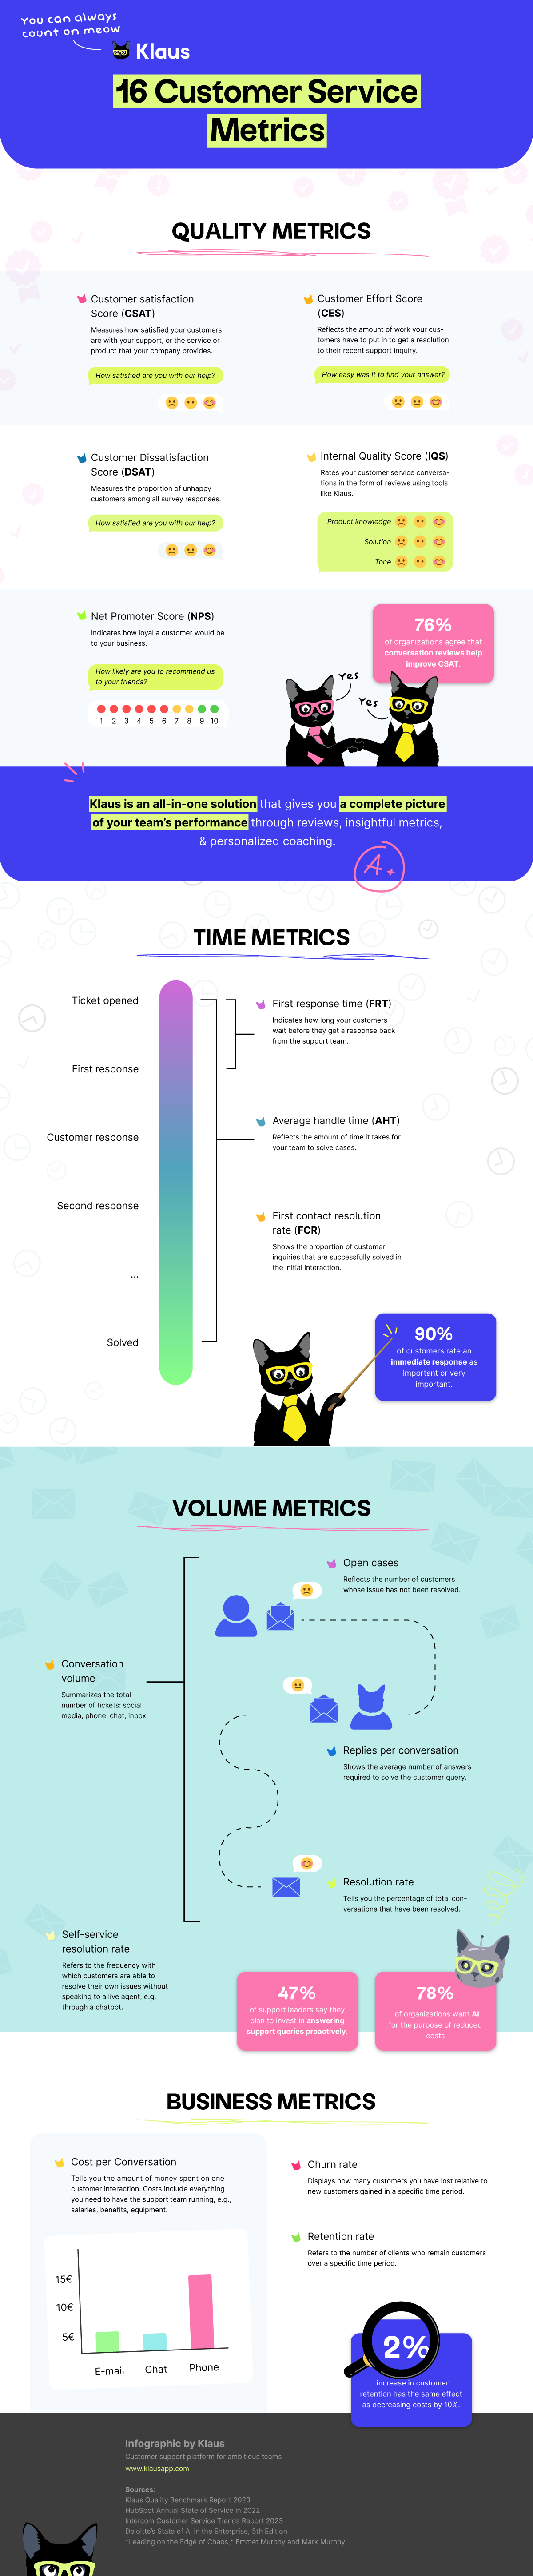
The A to Z of customer support metric examples
To achieve a comprehensive view of your customer service team, there are four elements to consider:
- Quality
- Timing
- Volume
- Business impact
Read through our explanations of each component carefully to understand their significance in enhancing your customer service operations. Learning how to measure each one will give you insight into what to prioritize for your current support goals.
Customer service metrics: Quality
Quality is the differentiating factor in customer service. 79% of customer service leaders agreed that customers are smarter and more informed now than in the past.
Therefore, companies that prioritize excellent customer support are outpacing the pack.
To place yourself in that category, it is crucial to enhance the way you communicate with your customers. Managing customer support quality requires persistent, conscientious effort.

Customer Satisfaction Score (CSAT)
Customer Satisfaction (CSAT) is a metric often used to measure how satisfied your customers are with your support team, or the service/ product that your company provides. Customer Satisfaction Score is measured by using variations of the question:
“How would you rate the support you received?”
The rating scale can be as simple as a choice between thumbs up and thumbs down, though is usually more granular. The results are averaged out to give a composite Customer Satisfaction Score, usually expressed as a percentage: 100% being total customer satisfaction, 0% total customer dissatisfaction.

Customer Dissatisfaction Score (DSAT)
Customer Dissatisfaction (DSAT) is a metric used to counter satisfaction rate. It measures how many customers are dissatisfied with your support, or the service/product that your company provides.
The definition of “dissatisfied” can vary by company, depending on how granular your rating scale is. For example, on a scale of 1 to 5, a score of 3 could be considered neutral or could be considered dissatisfied.
Net Promoter Score (NPS)
While Customer Satisfaction Score (CSAT) is a transactional quality metric asked after a specific interaction, Net Promoter Score (NPS) is a more holistic metric designed to measure the customers’ overall experience with your company.
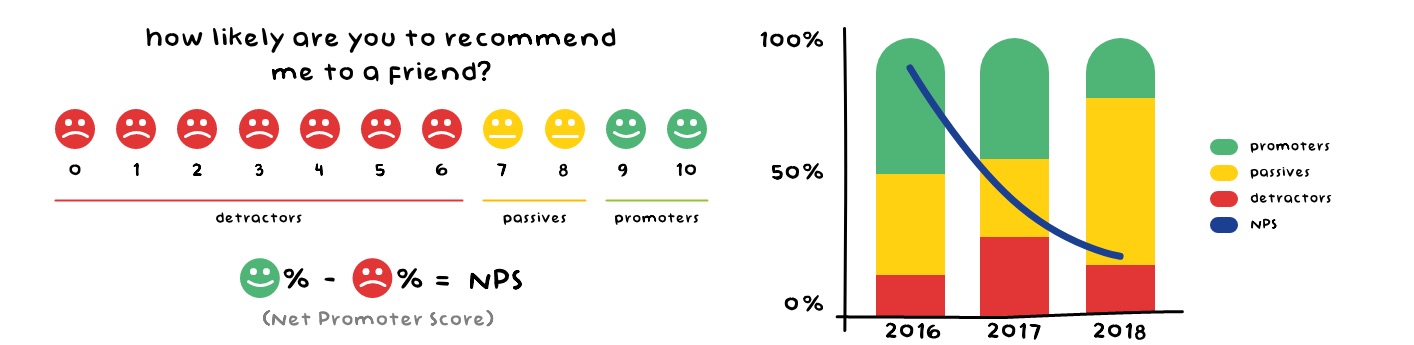
Net Promoter Score asks the question:
“On a scale of zero to 10 how likely are you to recommend us to a friend or colleague?”
Customers who answer 9 or 10 are considered Promoters and are your best brand advocates, 6 and lower are Detractors and are likely to churn.
Net Promoter Score is traditionally used as a metric for product or marketing teams. As support should be considered a part of your company’s product, support makes an impact on NPS as well. It’s a great way to align all teams towards a common goal: the customer.
Internal Quality Score (IQS)
While CSAT and NPS present your customer’s point of view, your Internal Quality Score (IQS) rates your customer conversations from your own perspective. This can be done as self-reviews, manager reviews, or peer reviews.
The values that are important to your support organization and the qualities of a successful support interaction should be defined in your rating categories (e.g. solution, tone, product knowledge). These make up the aggregate internal quality score.
The quality of your support interactions affects almost all relevant KPIs and customer service metrics. By analyzing your interactions according to internal standards, you find gaps in your knowledge. This serves as the basis for improvement in all areas.
Customer Effort Score (CES)
Your company’s Customer Effort Score (CES) reflects the amount of work your customers have to put in to get a resolution to their inquiry. Much like CSAT, it is measured by asking customers to rate whether they agree with a statement like:
“Your company made it easy for me to handle my issue.”
Support should come effortlessly and not be a burden. A customer shouldn’t be pulling teeth to get their problems resolved — and if they do, it probably indicates a larger issue with your product, tooling, or the way you do support.
Companies are increasingly investing in proactive support through customer service automation. From having a searchable knowledge base to building a customer community, there are many ways to help customers independently find a solution to their problems and improve the Customer Effort Score.

Video: Quality Customer Service Metrics That Actually Matter
Watch this video to understand which support quality KPIs will guide you to…
- Improved feedback
- Better team performance
- (and ultimately) Happier customers.
Customer service metrics: Time
Time is a crucial factor in your customer support interactions, and extended waiting periods can often cause customer dissatisfaction.
It is important to note that, as discussed above, improving proactive support can assist customers in resolving basic issues on their own. However, checking in on the customer service metrics discussed below is crucial to evaluate your team’s ability to handle more complex problems.
First Response Time (FRT)
First Response Time (FRT), also known as Time to First Response, is a crucial customer service metric that indicates how long your customers have to wait before they get a response to their inquiry.
Time to First Response = total time until an agent takes on a case / total number of tickets
Some leaders believe that customer reps should not reply to a support ticket before they have an answer to their client’s problem. But customers have grown to expect near-immediate acknowledgment of their case (and regular updates to reassure them that a solution is in process).

Average Handle Time (AHT)
Average Handle Time (AHT) is the amount of time that it takes from opening a support ticket, chat, or phone conversation to hitting Send or hanging up the phone. To calculate AHT, add up the total amount of time spent on resolving conversations and divide it by the total number of conversations.
AHT = total time spent on resolving conversations / total number of conversations
AHT is directly related to other ticket-based metrics such as replies per conversation, ticket volume, and CSAT. One productivity metric that is strongly impacted by handle time is the number of contacts that an agent can handle in a month – the lower the average handle time, the more contacts an agent can work through.

Customer service metrics: Volume
The previously described time-related metrics are closely tied to how many customer queries you receive. These customer service metrics examples measure volume. Check in on them to understand and forecast high and low periods – essential when you want to analyze staffing needs and put other metrics into context.
Conversation Volume
Conversation/Ticket volume is the main metric when it comes to knowing how fast the treadmill is running. Conversation volume includes everything from the tickets in your inbox to conversations in social media, phone, and chat support.
Conversation Volume = tickets in inbox + social media + phone calls + chat
Tracking conversation volume over a long period of time (years), can give you incredible insight into your customer support team trends. You’ll find your busiest periods and understand when you need to hire more staff.

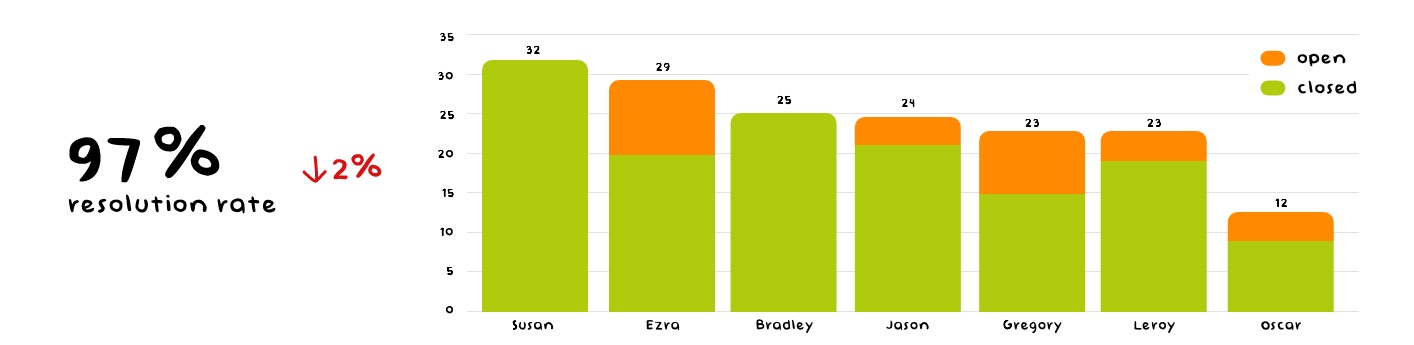
Resolution Rate
The resolution rate tells you the percentage of the total conversation volume that your team has resolved. In other words, it helps you understand how well you are tackling your incoming support tickets.
Resolution Rate = (support tickets solved / total number of tickets)
Ideally, the resolution rate should remain the same as your company grows. If you see your resolution rate go down, it means you are not handling support tickets as fast as you used to. This might hint you to consider hiring more customer support agents.
Open Cases
Knowing how many tickets are currently open and how long they’ve been open for, is a great metric for analyzing your backlog. Current open conversations reflect the number of customers who are currently waiting for a response.
Open Cases = total number of cases – resolved cases
It’s a great indicator for managers if queue response times are getting out of hand. Having more open tickets than normal will likely result in a prolonged average wait time. For team leads, keeping an eye on current open conversations in different queues can help them prioritize their customer service representatives’ work.

Replies per Conversation/Replies per Ticket
Replies Per Conversation (RPC) is the average number of answers that it takes to resolve an issue for your customer. In certain cases, this can give you valuable insight into how your team is doing.
Replies Per Conversation = total number or replies/number of tickets
If you see the number of RPC climb up, it may mean that your employees are not paying as close attention to the customers’ problems as they could be.

First Contact Resolution Rate (FCR)
Across all forms of contact, the First Contact Resolution (FCR) rate means solving customer service requests in full with your first response. Customers love getting their questions solved quickly.
FCR Rate = number of cases resolved on first contact / total number of FCR-eligible cases
Not all tickets are FCR-eligible. For example, sometimes customers make mistakes in their inquiries and it just isn’t possible for you to fix their problems at the first attempt.

How First Contact Resolution Rate correlates with Customer Satisfaction Score (CSAT), according to MetricNet
Escalation Rate
In an ideal world, you resolve all your tickets with a single response. However, every now and then you probably face cases that need more interaction. Escalation Rate tells you how many customer queries were not solved by first-line support agents and were escalated to seniors/managers.
Escalation Rate = Tickets that escalated from first line / total number of tickets
Aim to keep Escalation Rate as close to 0 as possible. If you see your Escalation Rate go up, you should dive into those escalated tickets with qualitative metrics like Internal Quality Score. This will help you understand if the quality of your customer service has gone down or perhaps there are issues within the products that need to be solved.

Self-service Resolution Rate
The self-service rate measures the percentage of customers who are able to resolve their issues without the assistance of a customer service agent. They may have managed this via consulting a Knowledge Base, searching FAQs, or through a chatbot.
Self-service resolution rate = (Knowledge Base sessions + chatbot sessions + FAQ visits) / total support team tickets
These methods are all part of proactive support, in which companies often rely heavily on automation and AI to relieve the workload of their agents.
Customer service metrics: Business
Customer service is a core part of your company and it has a significant impact on your business results. Thinking of the support department as a cost center is now an outdated notion. Your customer conversations contain a wealth of knowledge through which you can predict and explain their behavior.
Support conversations provide invaluable, direct insights into customer sentiment, which can have a significant impact on business outcomes like churn and retention.
The below business metrics are important for support leaders to report back to executives, and other teams, to help ignite support-driven growth & inspire development.
Churn Rate
Customer Churn Rate tells you how many customers you’ve lost relative to the new customers you’ve gained in a specific period of time. This is particularly important considering that acquiring new customers costs your business far more than retaining existing ones.
Churn Rate = Lost customers / remaining customers, including new customers
Keeping the customer churn rate as low as possible is a company-wide effort. Customer service has an important role in making sure that customers don’t leave due to a lack of information or help.

Retention Rate
The Retention Rate is the opposite of the Churn Rate. Customer Retention Rate refers to the number of people who have remained your customers over a specific period of time.
Retention Rate = Number of customers at the end of the period / number of customers at the beginning
Customer Retention Rate gives you insight into how your new customer service efforts are paying off. For example, if you’ve published a thorough Knowledge Base, compare your current Retention Rate with that of the pre-knowledge-base period to see any changes in customer loyalty.

Cost Per Conversation
Cost Per Conversation (CPC) is the total cost of operating your team, divided by the total number of conversations that you have across your support platforms. Costs include salaries, health insurance, other benefits, equipment, and everything else that you need to have the customer support team running.
CPC = total team operating costs / total number of conversations
You can calculate CPC across the span of a year, a month, or any other period. Count for only the time that your customer service agents are dedicated to customer interactions. That’s an important aspect of your team members spending some of their time on responsibilities other than support.

Which are the most important customer service metrics?
Different customer service teams attack their metrics and reporting in different ways. Of the 16 main customer service KPIs listed, we would not recommend that you trace and give equal value to each one simultaneously.
Choose your customer support metrics wisely
Focus on obtaining a general understanding of your team’s performance and identifying areas that require improvement. After that, select the customer service KPIs that align with those areas.
Some customer service teams prioritize speed. To assess customer service performance, they take the volume of conversations and the FCR. Both metrics are easy to track, within the agents’ control, and generate enough data points to look sexy on a dashboard.
But if you do this, you are getting no insight into the quality of responses your customer service agents provide.
That missing perspective will become a big problem when you want to go beyond fast replies and invest in making customers happier with better-quality answers.
So, many support teams then start to track Customer Satisfaction Score. CSAT is widely recognized as the most ‘popular’ and important customer service metric — although, our 2023 benchmark report only found that 23% mark CSAT as their most important customer support KPI.
CSAT gives you an indication as to how customers perceive the support they receive. And this information is, of course, meaningful. But putting too much emphasis on customer-defined metrics still leaves you blindsided when it comes to improving.
The problem with CSAT
One of the main issues with only measuring CSAT is that it is a subjective and reactive measure. It only captures how people feel about their customer experience after the fact, and it does not provide insight into the factors that led to their satisfaction or dissatisfaction.
- Reply time,
- Product approval,
- How their day is going.
Not all customers leave a rating. And only 19% of all those ratings have a comment in addition to the score. Comments provide context, without them, the lights are not out but they’re certainly very dim. CSAT is important, but it should not be too heavily relied upon as an instigator of change.
Also, relying solely on CSAT can lead to a reactive approach to customer service, where teams are primarily focused on fixing issues after they occur, rather than proactively improving the customer experience.
So, how can you measure customer service quality?
The internal quality score (IQS) is the internal counterpart to CSAT.
Here an internal reviewer (a peer, specialist, or manager) rates and reviews aspects of the interaction to assign a quality score. The exact categories are different from company to company, e.g.:
- Product Knowledge
- Process Adherence
- Tone of voice

You can rate each of these areas with one category or subdivide them into several categories. Remember that customer service agents will optimize performance for whatever you are measuring, as long as reviews and ratings are delivered regularly in meaningful numbers.
Regular reviews can mean ten reviews per week or ten reviews per month. It simply needs to be regular enough so that agents can expect those reviews and see their own progress over time. It’s important that the reviewer has enough to spot patterns instead of basing an entire evaluation on a single case.
Make the metrics matter
Collecting data on your conversations is pointless if you fail to utilize it.
We often hear from our clients that they prioritize being data-driven. However, data collection alone is insufficient. To truly embody a data-driven approach, you must also be data literate, which involves the ability to read, analyze, and effectively communicate using data.
What gets measured, gets manipulated.
Now is where the right tools come in handy…
Customer service metrics — dashboard
Having all of your customer support KPIs tracked in one place is a vital tool for better decision-making. Consolidating your metrics makes it easier for you to interpret the information, and identify trends that might not be immediately apparent from raw data.
For example, Zendesk QA (formerly Klaus) helps you compare support teams, analyze coaching effects, and understand qualitative and quantitative in conjunction with each other. All of this makes improving easier!

A visual representation of customer service performance over time gives you clearance to:
- Track progress
Monitoring, for example, CSAT in relation to IQS helps you identify trends and measure the effectiveness of your strategy. - Identify areas of improvement
Understand where and why your customer service team is falling short – and perhaps forecast better to prepare for busier periods. - Make data-driven decisions
Use these support metrics to make informed decisions about staffing levels, training needs, and process improvements. - Create better reports
A metrics dashboard can help align your customer service team with the broader goals of your organization.
The feedback loop starts with understanding the numbers. It can only close when you put the numbers into action. By using data to provide feedback and coaching, you can help your teams understand their performance in a more tangible and measurable way. Ready when you are.
Originally published in August 2020; last updated in November 2023.